Lab 1: M1.1 Fundamentals
Lab 1: M1.1 Fundamentals
Welcome back blog readers! It's been.. not that long. But we're at the beginning of the end! Its officially the Fall Semester. I am taking 3 courses this semester. Special Topics in Geographic Science, Aerial Photography and Remote Sensing, and the GIS Internship course.
Since the GIS Internship course runs the whole semester, a few blogs from that course will be scattered through our usual line up.
But the first blog due is for Special Topics.
This first week in GIS4930 we went over the Fundamentals of Data Quality, specifically, Calculating Metrics for Spatial Data Quality to better understand the difference between precision and accuracy.
We learned how to calculate the vertical and horizontal position accuracy and precision, calculate root-mean-square-error (RMSE) and cumulative distribution function (CDF)
The only "new" tool I don't think we have been specifically told to use before was the measure tool, but I use this frequently at work, so no issues.
Honestly, besides the math, the thing that gave me the most pain was remembering how to edit a chart in excel (which prior blog posts have address our love-hate relationship).
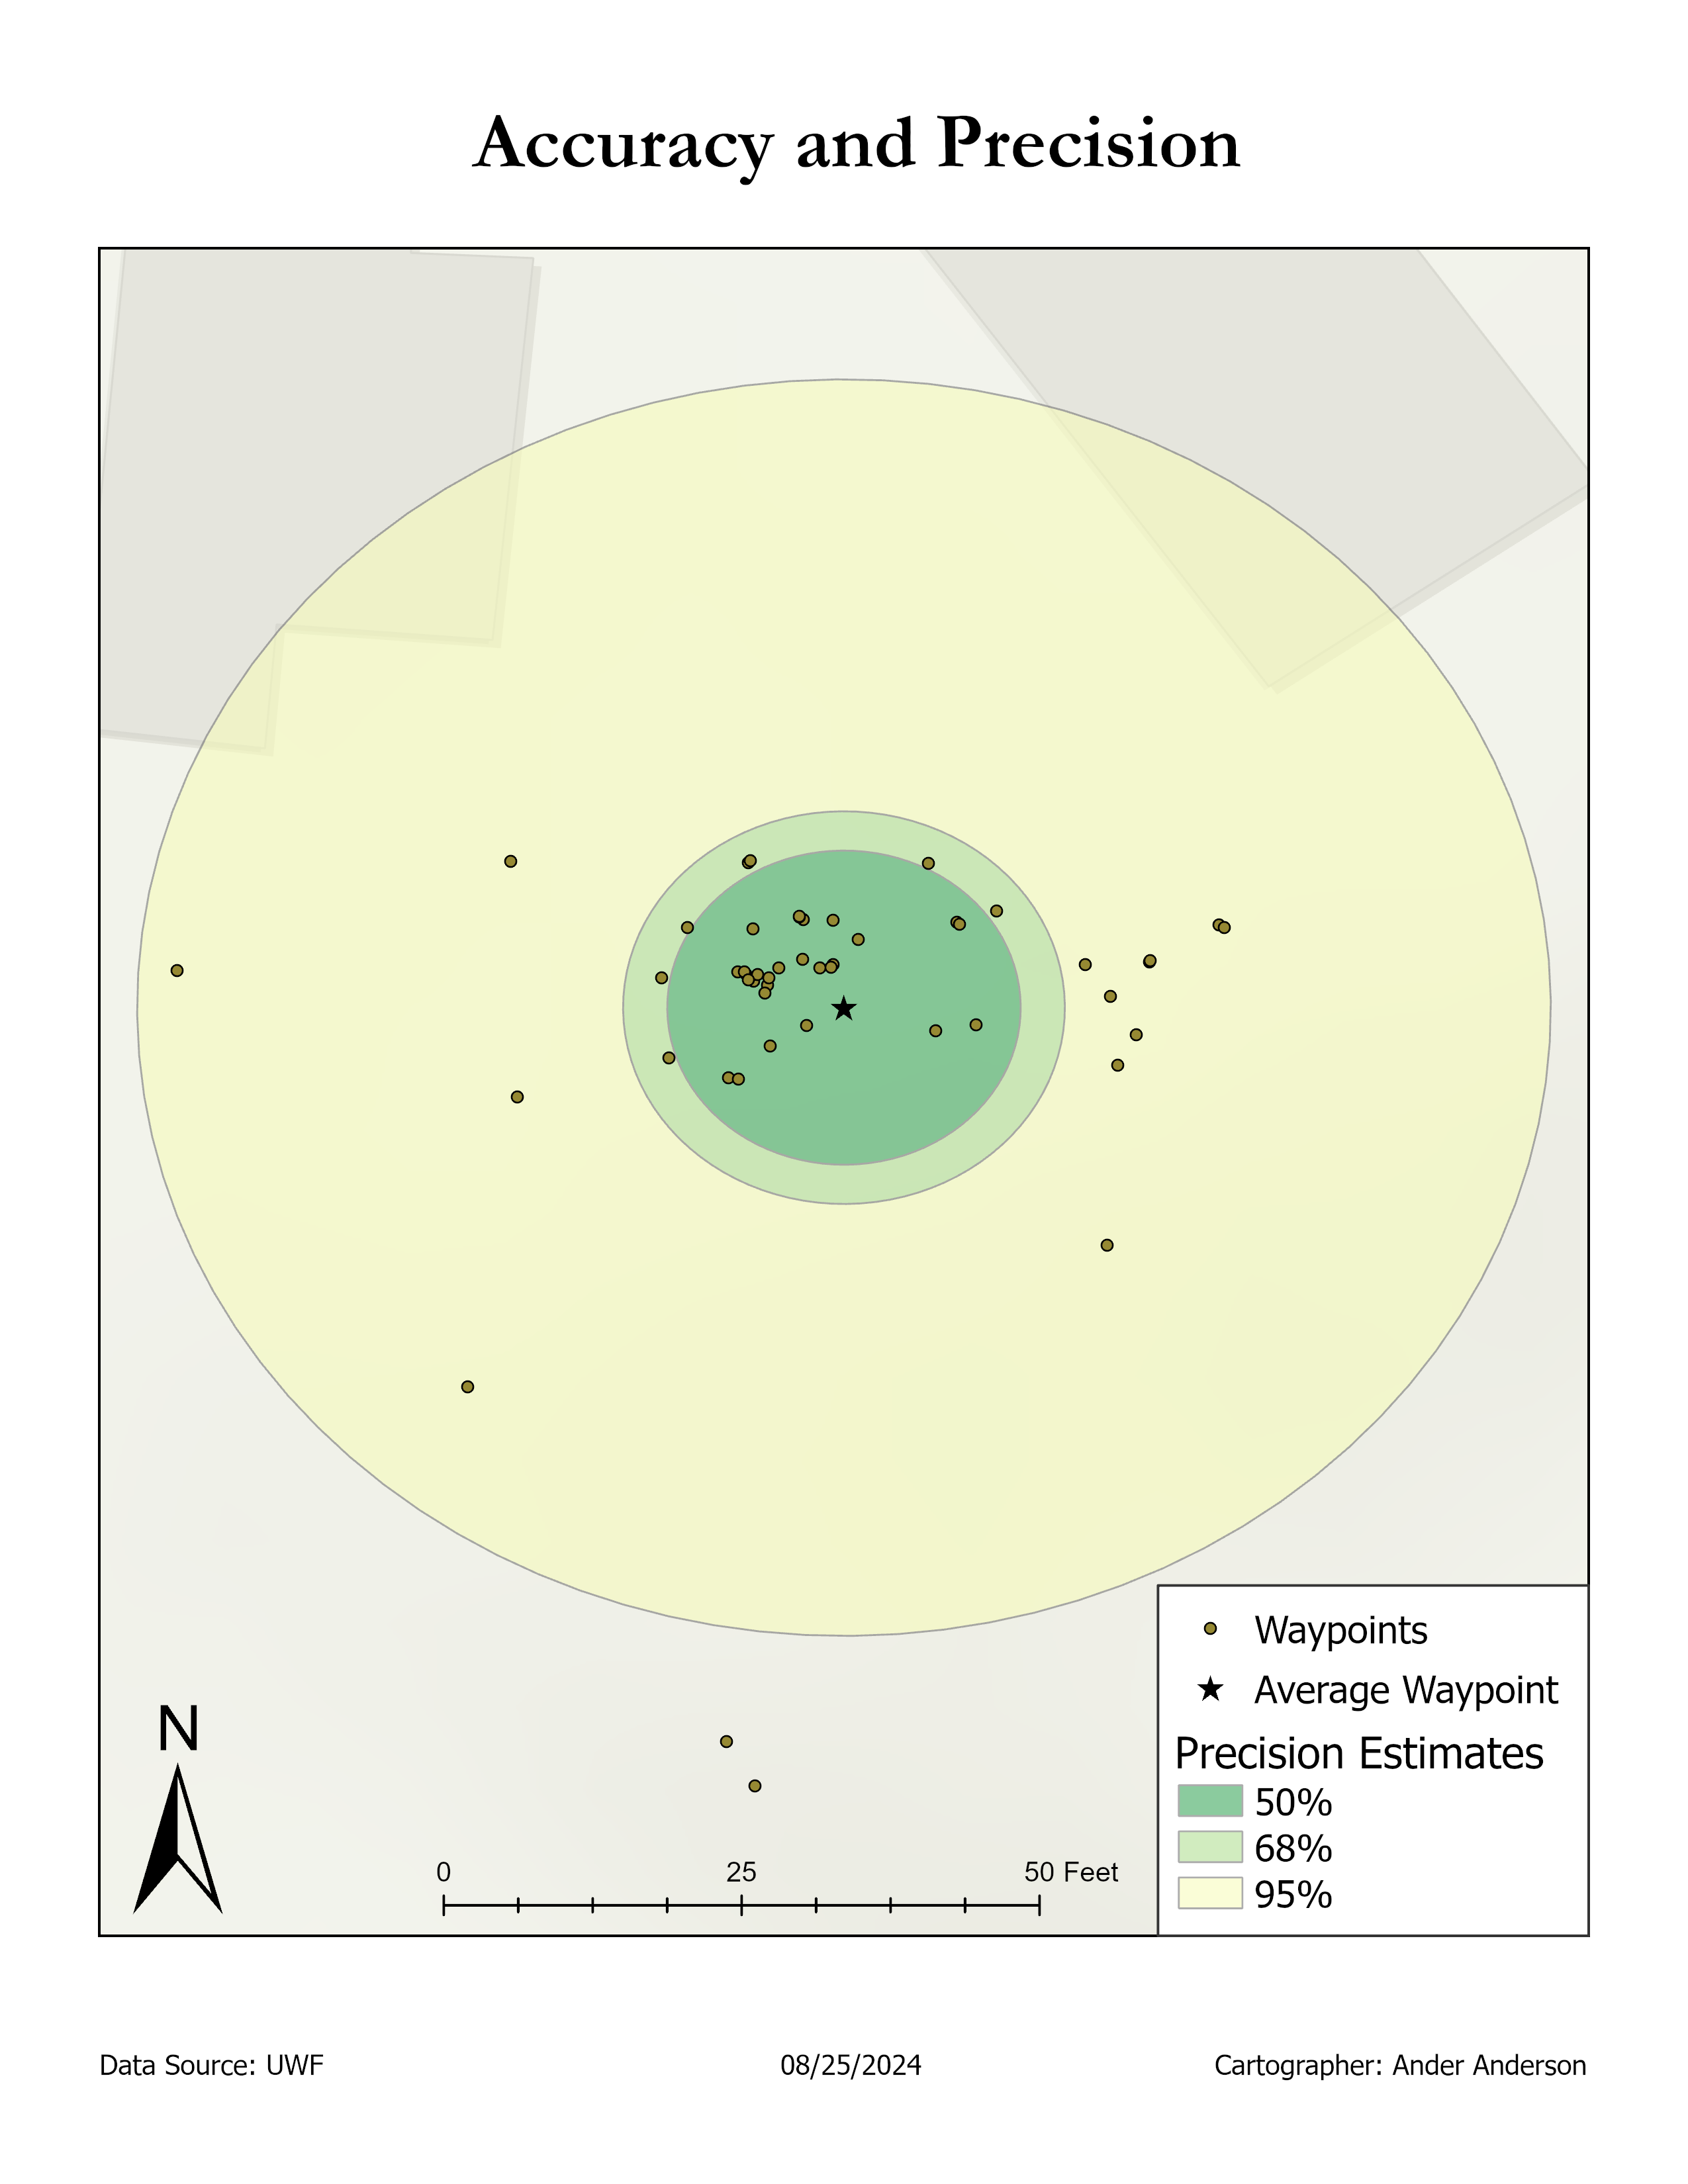
The map below shows the projected waypoints, the average location, and buffers for the precision estimates.
|
Horizontal
accuracy |
-6.066 |
|
Horizontal
precision |
4.293 |
|
Difference |
10.359 |
Horizontal accuracy measures how close the GPS measurements are to the true location. Horizontal precision measures the spread of the GPS measurements around the mean location. I believe our lab instructions said it best - The larger the value, the lower the precision. The larger the distance, the lower the accuracy.
Thankfully this lab was fairly direct. I have been studying for the CompTIA Security+ Exam and I'll be taking it tomorrow (Wednesday) so hopefully my next blog I can report that my CompTIA journey for this year is complete and I can completely focus on GIS again.
Comments
Post a Comment